Simplifying complex trading journeys for professional traders
Simplifying complex trading journeys for professional traders
Simplifying complex trading journeys for professional traders

Strike is a fintech platform designed for pro-traders—people who work with speed, precision, and data. Our challenge was to simplify an overwhelming system of stock analysis tools without losing its depth or intelligence. I was lead the design execution from a UX lens—so that traders could focus on thinking, not navigating.
Strike is a fintech platform designed for pro-traders—people who work with speed, precision, and data. Our challenge was to simplify an overwhelming system of stock analysis tools without losing its depth or intelligence. I was lead the design execution from a UX lens—so that traders could focus on thinking, not navigating.
Strike is a fintech platform designed for pro-traders—people who work with speed, precision, and data. Our challenge was to simplify an overwhelming system of stock analysis tools without losing its depth or intelligence. I was lead the design execution from a UX lens—so that traders could focus on thinking, not navigating.
Skills
Skills
Skills
Research, Strategy & Design
Research, Strategy & Design
Research, Strategy & Design
My Role
My Role
My Role
UX Designer
UX Designer
UX Designer
Timeline
Timeline
Timeline
8 months
8 months
8 months
Team
Team
Team
3 UX Designers & 1 Visual Designer
3 UX Designers & 1 Visual Designer
3 UX Designers & 1 Visual Designer
Project Goals
We partnered with Indiacharts to transform expert-level market analysis into intuitive, accessible tools. Built on the trading insights of Rohit Srivastava, we transformed dense financial data into an insightful, accessible experience. With proprietary offerings like RMI, RRG charts & diffusion indicators, Strike makes institutional-grade analysis easier. They were looking to redesign and automate their complex services. The existing product exposed all its features upfront causing cognitive overload.
Business goals

01
Higher activation and retention from pro users
01
Higher activation and retention from pro users
01
Higher activation and retention from pro users
01
Higher activation and retention from pro users
02
A modular platform that could support multiple workflows
02
A modular platform that could support multiple workflows
02
A modular platform that could support multiple workflows
02
A modular platform that could support multiple workflows
03
A system flexible enough for future customisations
03
A system flexible enough for future customisations
03
A system flexible enough for future customisations
03
A system flexible enough for future customisations
"Strike by Indiacharts isn’t just a platform—it’s a step toward financial literacy. By simplifying tools, it empowers individuals to make smarter, self-reliant investing decisions."
"Strike by Indiacharts isn’t just a platform—it’s a step toward financial literacy. By simplifying tools, it empowers individuals to make smarter, self-reliant investing decisions."
"Strike by Indiacharts isn’t just a platform—it’s a step toward financial literacy. By simplifying tools, it empowers individuals to make smarter, self-reliant investing decisions."
"Strike by Indiacharts isn’t just a platform—it’s a step toward financial literacy. By simplifying tools, it empowers individuals to make smarter, self-reliant investing decisions."
Discovery & Strategy
To get started, we had two detailed discovery sessions with the client aimed at understanding the business, users, vision and scope for the Strike application.
Discovery & Strategy
To get started, we had two detailed discovery sessions with the client aimed at understanding the business, users, vision and scope for the Strike application.
Discovery & Strategy
To get started, we had two detailed discovery sessions with the client aimed at understanding the business, users, vision and scope for the Strike application.
Discovery & Strategy
To get started, we had two detailed discovery sessions with the client aimed at understanding the business, users, vision and scope for the Strike application.
How we did it


Heuristic Evaluation
To test usability, I utilised various evaluation criteria such as - Jakob Nielsen’s Heuristics, laws of UX, gestalt’s design principles & design principles. This process enabled us to pinpoint product issues, prioritise them, and deepen our understanding of the domain's intricacies.

Prioritisation Matrix
We uncovered 170+ issues. We prioritised most critical and startegic issues to be solved first as they were most hihg impact, and least critical & tactical later.
Prioritisation Matrix
We uncovered 170+ issues. We prioritised most critical and startegic issues to be solved first as they were most hihg impact, and least critical & tactical later.
Prioritisation Matrix
We uncovered 170+ issues. We prioritised most critical and startegic issues to be solved first as they were most hihg impact, and least critical & tactical later.
Prioritisation Matrix
We uncovered 170+ issues. We prioritised most critical and startegic issues to be solved first as they were most hihg impact, and least critical & tactical later.

Competitor Benchmarking
• To learn from best practices in the industry and scope for innovation • To gather insights into the intricacies of the trading industry and user behavior patterns Here is an example of Trendlyne summarised.
Competitor Benchmarking
• To learn from best practices in the industry and scope for innovation • To gather insights into the intricacies of the trading industry and user behavior patterns Here is an example of Trendlyne summarised.
Competitor Benchmarking
• To learn from best practices in the industry and scope for innovation • To gather insights into the intricacies of the trading industry and user behavior patterns Here is an example of Trendlyne summarised.
Competitor Benchmarking
• To learn from best practices in the industry and scope for innovation • To gather insights into the intricacies of the trading industry and user behavior patterns Here is an example of Trendlyne summarised.
The challenge
Trading is a complex domain to understand and since we were designing for pro traders, we had to get ourselves to get well-versed with the different techniques they use for trading. It was a steep learning curve.
Standout Shift: From Features to Journeys
Instead of organising the product around features, I mapped it around real-life trading flows. I identified core decision-making paths, task frequency and time sensitivity. Based on behaviour patterns, I came up with Discover, Analyse and Learn, as three core user journeys. This became the backbone for our new information architecture. Simplified primary navigation & clustered modules into task-based journeys.
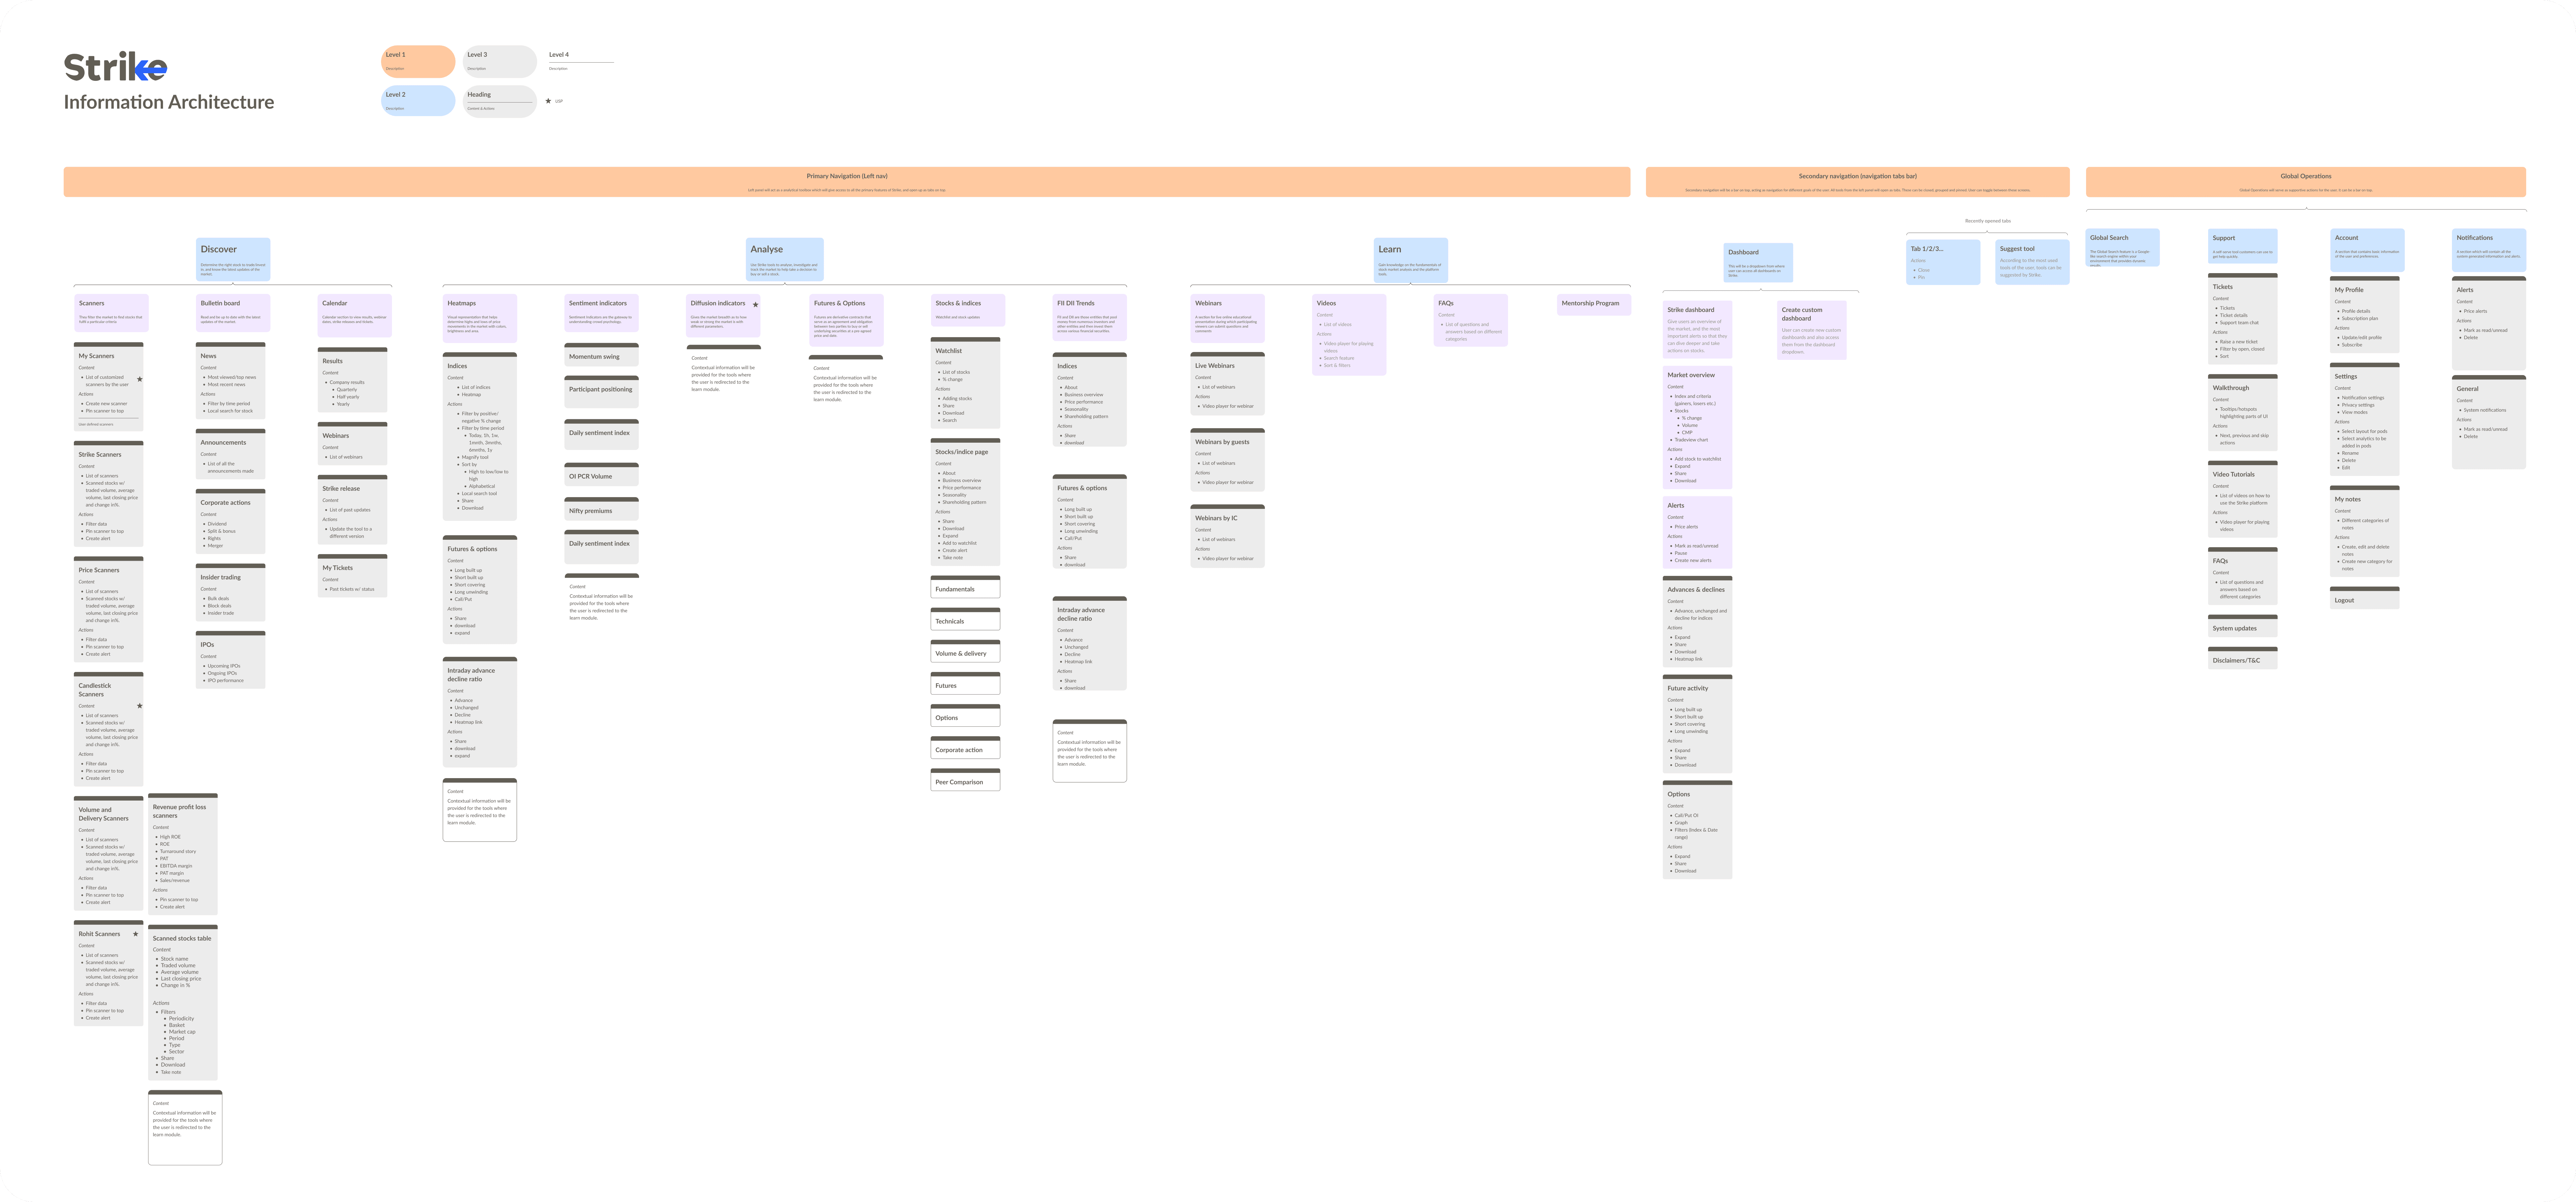
#1 | Intent-driven Primary Navigation
• Discover: explore new stocks & sectors surfacing outliers, trends, and shifts at a glance. • Analyse: During high-intensity periods, traders dive deep into specific assets. Tools supports sharp focus and fast decision-making. • Learn: In slower, reflective moments, educational & historical insights help them build skill and confidence over time.

#2 | Rapid Multi-tasking Tabs
I introduced a browser-style tabbed interface, allowing traders to open tools as tabs. This empowers them to: • Stay in flow by rapidly switching between tools • Customize their workspace based on trading strategy • Minimize context-switching fatigue during high-pressure sessions This layout mirrors mental models already familiar from web browsers—intuitive, scalable, and efficient, unlike traditional platforms that force them to toggle between nested menus causing friction in their workflow.

#3 | Dynamic Relative Rotation Graphs
RRG is a type of analytical tool that will allow you to quickly identify emerging trends and shifts in the market. By following the movement of each asset, you will see the cyclical clockwise direction develop. The colour-coded quadrants allow you to quickly scan a large number of asset at once and identify which ones are worth further investigation.

Business Impact
Business Impact
Business Impact
Business Impact
01
2000+ sign ups in the forst 30 days indicating high engagement
01
2000+ sign ups in the forst 30 days indicating high engagement
01
2000+ sign ups in the forst 30 days indicating high engagement
01
2000+ sign ups in the forst 30 days indicating high engagement
02
Lowered onboarding & training costs by reducing learning curve; increased ROI
02
Lowered onboarding & training costs by reducing learning curve; increased ROI
02
Lowered onboarding & training costs by reducing learning curve; increased ROI
02
Lowered onboarding & training costs by reducing learning curve; increased ROI
03
Shortened time to trade: fewer steps, clearer flows
03
Shortened time to trade: fewer steps, clearer flows
03
Shortened time to trade: fewer steps, clearer flows
03
Shortened time to trade: fewer steps, clearer flows
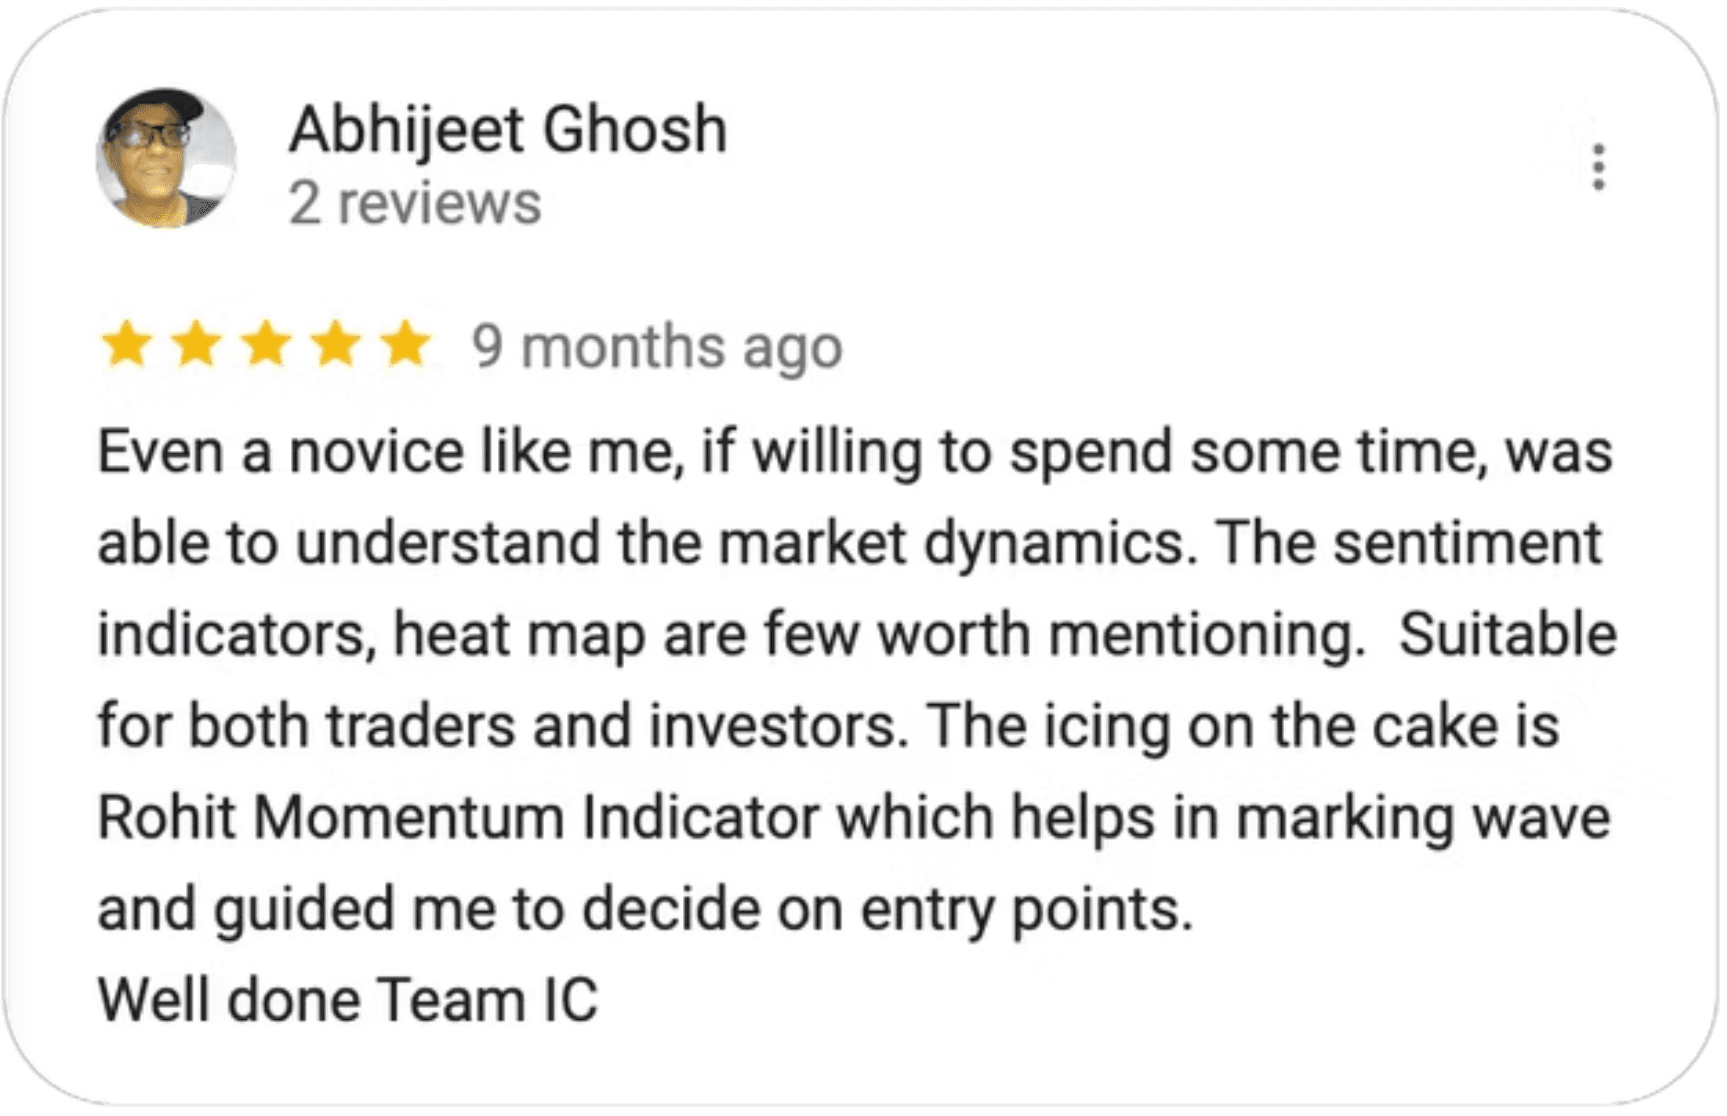
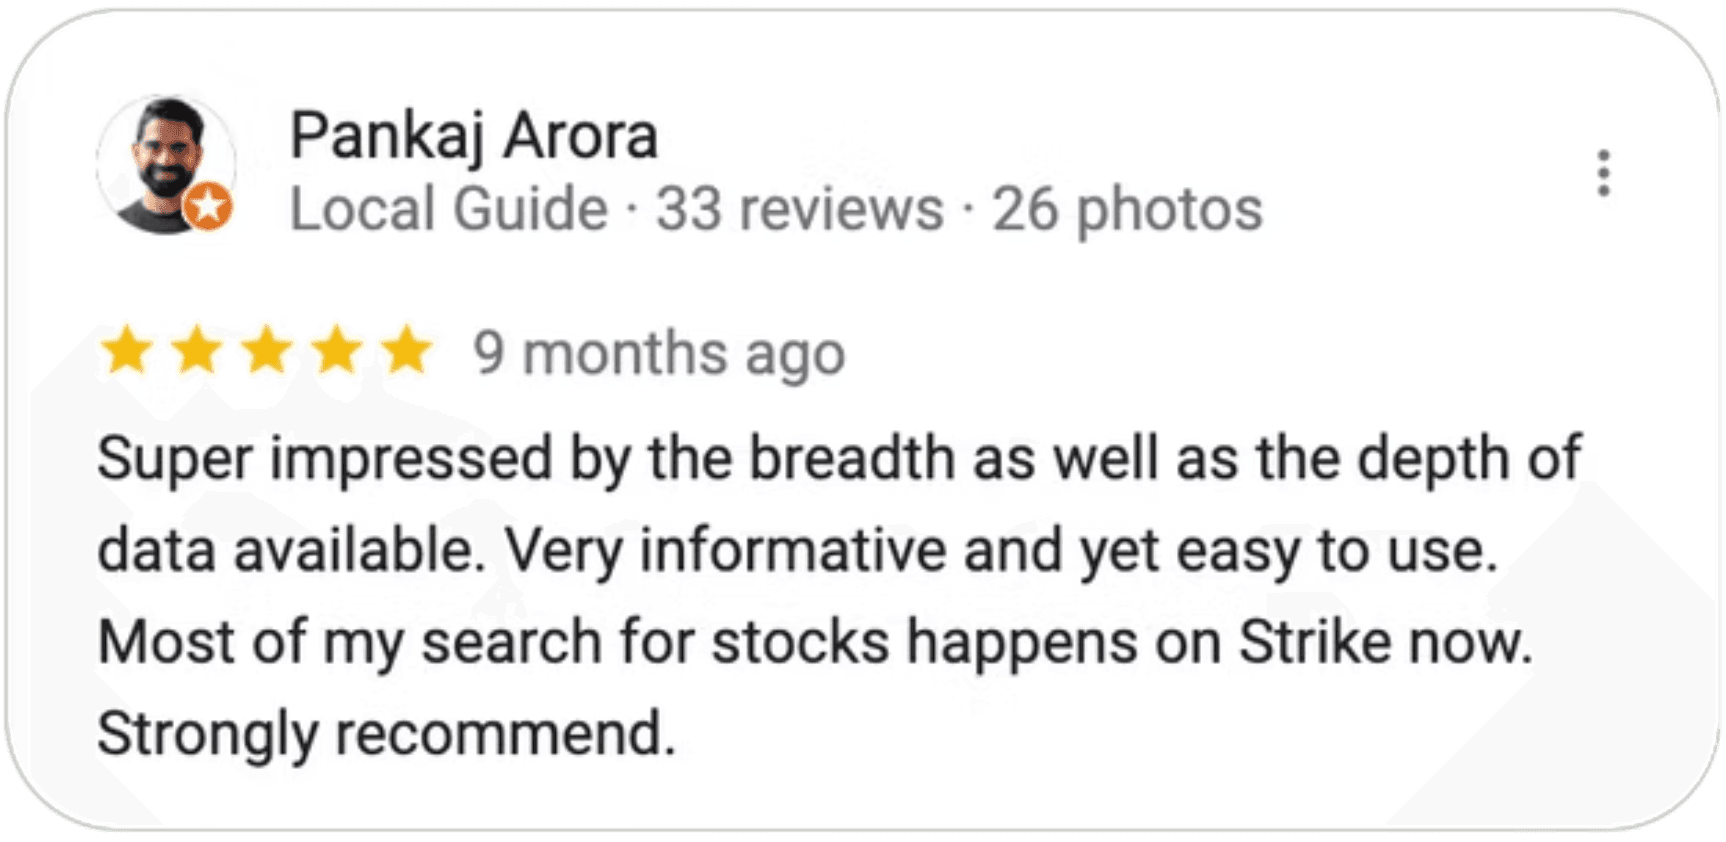
Google Reviews
Google Reviews
Google Reviews
Google Reviews